

Memory and Performance
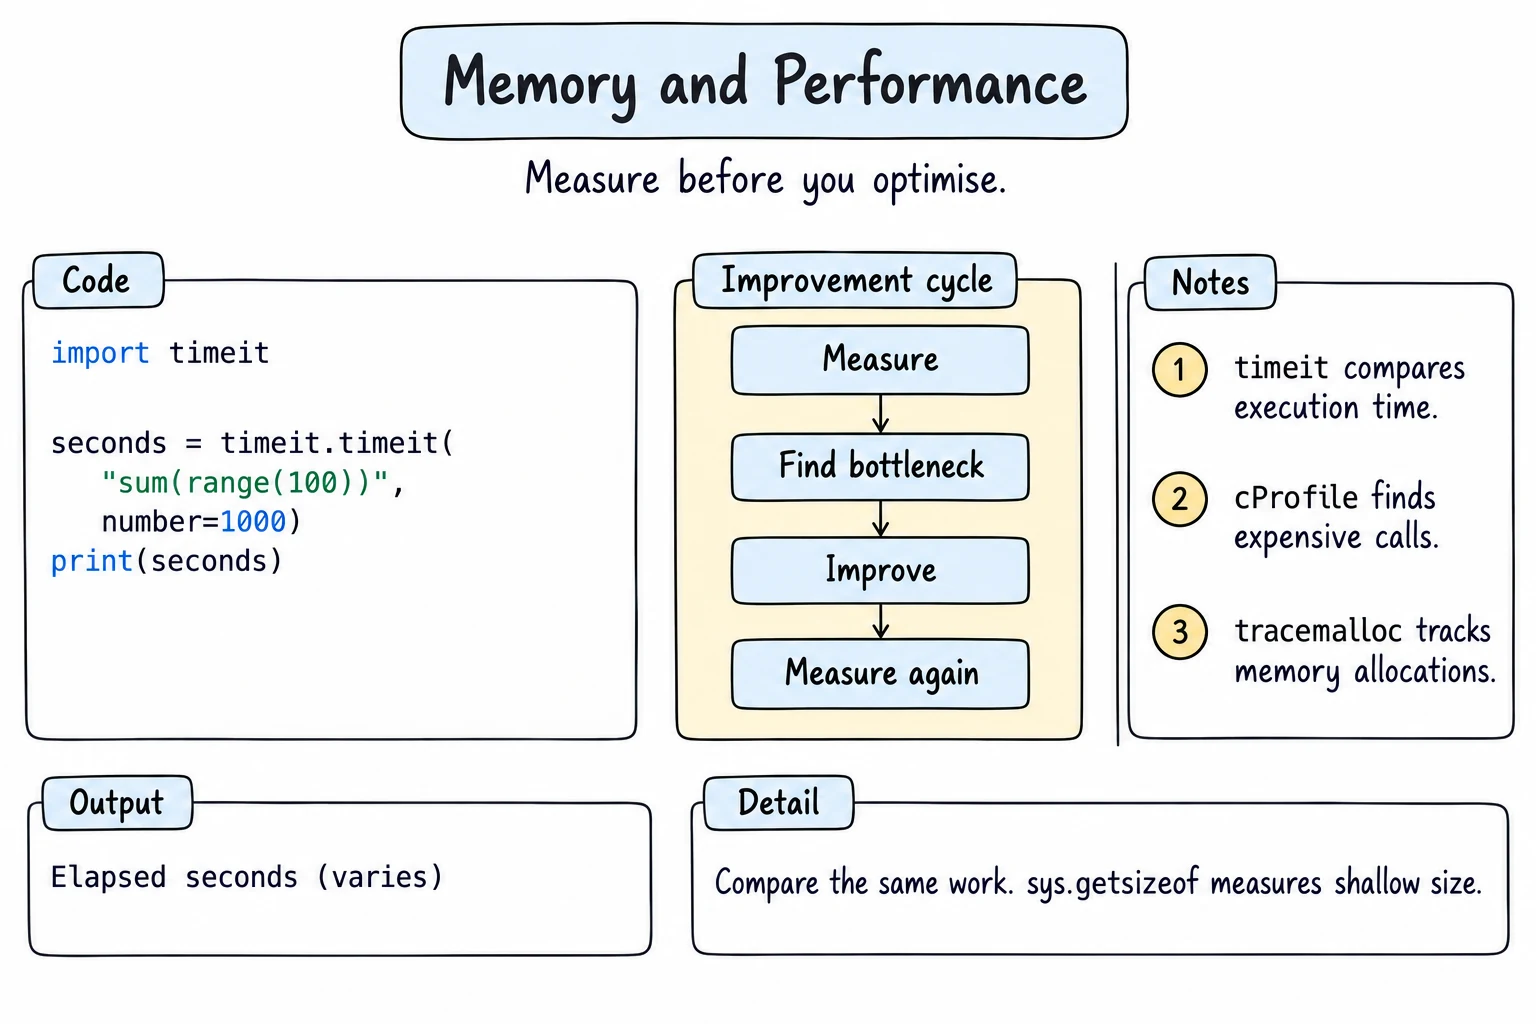
What you'll learn
- How to measure speed with
timeitandtime.perf_counter - What
sys.getsizeofreports, and howtracemallocshows where memory goes - How reference counting,
gc, andweakrefdecide when objects are freed - How to find slow functions with
cProfileandpstats - Which speed-ups matter (sets,
join, built-ins,lru_cache), and when not to optimize
Why it matters
A Samarkand shop's sales report takes 40 minutes, or a web app slowly eats memory. Usually one slow lookup or growing list is to blame. Python's built-in tools find that spot, so you fix the code that matters and keep the rest readable.
Measure before guessing
timeit runs a statement many times and returns the total seconds; timeit.repeat does that several times, and the minimum is the least noisy result:
import timeit

ids = list(range(10_000))
ids_set = set(ids)

list_best = min(timeit.repeat("9_999 in ids", globals=globals(), number=1_000, repeat=5))
set_best = min(timeit.repeat("9_999 in ids_set", globals=globals(), number=1_000, repeat=5))

print("set is faster:", set_best < list_best)set is faster: TrueOn one laptop the list took 0.103 s and the set 0.00004 s. Your numbers will differ, so the example prints only the comparison. To time whole functions, time.perf_counter() (a high-resolution clock) fits in a decorator like those in Closures and Decorators:
import time

timings = {}

def timer(func):
    def wrapper(*args, **kwargs):
        start = time.perf_counter()
        result = func(*args, **kwargs)
        timings[func.__name__] = time.perf_counter() - start
        return result
    return wrapper

@timer
def loop_total(numbers):
    total = 0
    for n in numbers:
        total += n
    return total

@timer
def builtin_total(numbers):
    return sum(numbers)

numbers = list(range(1_000_000))
print(loop_total(numbers) == builtin_total(numbers))
print("fastest:", min(timings, key=timings.get))True
fastest: builtin_totaltimings held about 0.027 s and 0.007 s on that laptop: built-ins like sum run in C.
How big is an object?
sys.getsizeof(obj) returns the bytes of that object only. A list stores references to its items, so its size doesn't include the items themselves:
import sys

short = [letter for letter in "abc"]
long = [letter * 10_000 for letter in "abc"]

print(sys.getsizeof(7), sys.getsizeof("Tashkent"))
print(sys.getsizeof(short), sys.getsizeof(long))
print(sys.getsizeof([n for n in range(1_000)]), sys.getsizeof(n for n in range(1_000)))28 49
88 88
8856 200These numbers are for 64-bit CPython 3.14; the browser editor runs a 32-bit build and shows smaller ones. The pattern is what counts: both lists are 88 bytes, though one points to 30,000 characters, and a generator (Iterators and Generators) stays tiny while a list grows.
Reference counting, gc, and weakref
CPython counts the references to each object: every name, list slot, or attribute pointing at it. When the count reaches zero, the object is freed at once. sys.getrefcount shows the count (plus temporary ones), so compare differences:
import sys

prices = [15000, 8000]
before = sys.getrefcount(prices)

basket = prices
orders = {"lunch": prices}
print(sys.getrefcount(prices) - before)

del basket
print(sys.getrefcount(prices) - before)2
1Counting fails for a cycle: objects pointing at each other never reach zero. The garbage collector (gc) finds such groups now and then; gc.collect() runs it now. A weak reference watches an object without keeping it alive:
import gc
import weakref

class Customer:
    def __init__(self, name):
        self.name = name
        self.friend = None

gc.disable()                        # only collect when we ask
aziza = Customer("Aziza")
bobur = Customer("Bobur")
aziza.friend = bobur
bobur.friend = aziza                # a cycle
watch = weakref.ref(aziza)          # watch() gives the object or None

del aziza, bobur
print("alive after del:", watch() is not None)
print("gc found garbage:", gc.collect() > 0)
print("alive after collect:", watch() is not None)
gc.enable()alive after del: True
gc found garbage: True
alive after collect: FalseWeak references also make safe caches: a weakref.WeakValueDictionary drops an entry as soon as nothing else uses its value.
Finding where memory goes: tracemalloc
tracemalloc records each allocation and the line that made it:
import tracemalloc

def load_orders():
    return [{"id": n, "city": "Tashkent", "total": n * 1000} for n in range(50_000)]

def load_names():
    return [f"customer-{n}" for n in range(50_000)]

tracemalloc.start()
orders = load_orders()
names = load_names()
snapshot = tracemalloc.take_snapshot()
tracemalloc.stop()

for stat in snapshot.statistics("lineno")[:2]:
    frame = stat.traceback[0]
print(f"line {frame.lineno}: {stat.size / 1_000_000:.1f} MB")line 4: 12.8 MB
line 7: 3.2 MBLine 4, the dictionaries, is the place to look. For many small objects, __slots__ from The Python Data Model helps; get_traced_memory() returns current and peak bytes:
import tracemalloc

class Point:
    def __init__(self, x, y):
        self.x, self.y = x, y

class SlotPoint:
    __slots__ = ("x", "y")

    def __init__(self, x, y):
        self.x, self.y = x, y

for cls in (Point, SlotPoint):
    tracemalloc.start()
    points = [cls(n, n) for n in range(100_000)]
    current, peak = tracemalloc.get_traced_memory()
    tracemalloc.stop()
print(f"{cls.__name__}: {current // 100_000} bytes per point")Point: 127 bytes per point
SlotPoint: 87 bytes per point(64-bit CPython, including the list and integers.) A third less adds up over millions of objects.
Finding slow code: cProfile
A profiler records how often each function ran and for how long; pstats reads the results:
import cProfile
import pstats

def parse(line):
    city, amount = line.split(",")
    return city, int(amount)

def total_by_city(lines):
    totals = {}
    for line in lines:
        city, amount = parse(line)
        totals[city] = totals.get(city, 0) + amount
    return totals

lines = ["Tashkent,15000", "Samarkand,8000", "Bukhara,12000"] * 20_000

with cProfile.Profile() as profiler:
    total_by_city(lines)

stats = pstats.Stats(profiler).strip_dirs()
calls = stats.get_stats_profile().func_profiles
print("parse ran", calls["parse"].ncalls, "times")parse ran 60000 timesFor the full table, call stats.sort_stats("cumulative").print_stats(2). One run printed (your times will differ):
   ncalls  tottime  percall  cumtime  percall filename:lineno(function)
        1    0.028    0.028    0.075    0.075 sales.py:8(total_by_city)
    60000    0.026    0.000    0.038    0.000 sales.py:4(parse)
cumtime includes called functions, tottime doesn't. Start with the biggest cumtime in your own code.
Common speed-ups
Once a profile finds a hot spot, these fixes cover most cases:
- The right data structure:
inon a set is fast however big the set is; a list checks every item. "".join(parts)instead oftext += partin a loop.- Built-ins and comprehensions instead of manual loops.
- Local names in very hot loops:
sqrt = math.sqrtsaves a lookup per step (a small win). - Caching repeated work with
functools.lru_cache:
from functools import lru_cache

@lru_cache(maxsize=None)
def route_count(rows, cols):
    if rows == 1 or cols == 1:
        return 1
    return route_count(rows - 1, cols) + route_count(rows, cols - 1)

print(route_count(16, 16))
print(route_count.cache_info())155117520
CacheInfo(hits=196, misses=255, maxsize=None, currsize=255)Without the cache this makes about 310 million calls; with it, 451.
When not to optimize: code that runs once, finishes quickly, or isn't near the top of the profile. Clear code beats fast code nobody needed.
Try it
Change n to 100,000 and watch the gap grow.
Common mistakes
1. Comparing different amounts of work
import timeit

loop = timeit.timeit("[n * 2 for n in range(1000)]", number=10_000)
builtin = timeit.timeit("list(map(lambda n: n * 2, range(1000)))", number=100)
print(loop, builtin)0.3371560389999786 0.0063662349999731305The first ran 10,000 times, the second 100, so map looks 50 times faster; with equal number it is actually slower. Fix: use the same number, the same data, and min(timeit.repeat(...)).
2. Timing once with time.time()
import time

start = time.time()
total = sum(range(10_000))
print(time.time() - start)0.00016045570373535156One tiny run is mostly noise, and time.time() can jump with the system clock. Fix: use timeit for small snippets and time.perf_counter() for longer tasks.
3. An accidental reference keeps data alive
import weakref

class Report:
    def __init__(self, rows):
        self.rows = rows

def row_count(report, seen=[]):      # Bad: this list lives as long as the function
    seen.append(report)
    return len(report.rows)

report = Report(list(range(1_000_000)))
alive = weakref.ref(report)
print(row_count(report))
del report
print("still in memory:", alive() is not None)1000000
still in memory: TrueThe default list keeps every report ever passed in alive; globals and unbounded caches can do the same. Fix: don't store what you don't need.
4. Optimizing code that runs once
cities = "Tashkent,Samarkand,Bukhara".split(",")
# Bad: a cryptic "speed trick" in code that runs once
lookup = dict(map(reversed, enumerate(cities)))
# Good: obvious; the difference is microseconds
clear = {city: i for i, city in enumerate(cities)}
print(lookup == clear, clear)True {'Tashkent': 0, 'Samarkand': 1, 'Bukhara': 2}Fix: optimize only what a profile shows is slow.
Practice
1. Shallow and deep size
Write deep_size(items): sys.getsizeof of a list plus its items' sizes. For words = [word * 1000 for word in ["plov", "somsa"]] and short = [word[0] for word in words], print whether deep_size(words) > sys.getsizeof(words), then whether sys.getsizeof(words) == sys.getsizeof(short).
Solution
import sys

def deep_size(items):
    return sys.getsizeof(items) + sum(sys.getsizeof(item) for item in items)

words = [word * 1000 for word in ["plov", "somsa"]]
short = [word[0] for word in words]
print(deep_size(words) > sys.getsizeof(words))
print(sys.getsizeof(words) == sys.getsizeof(short))True
True2. Watch an object disappear
Create an Order, attach weakref.finalize(order, print, "Order 42 freed"), print deleting..., delete the object, then print done.
Solution
import weakref

class Order:
    pass

order = Order()
weakref.finalize(order, print, "Order 42 freed")
print("deleting...")
del order
print("done")deleting...
Order 42 freed
done3. Count the real work
delivery_cost(city) looks up {"Tashkent": 20000, "Bukhara": 35000, "Nukus": 50000} and adds one to a global calls counter (imagine a slow database query). Cache it with @lru_cache(maxsize=None), then for orders to Tashkent, Bukhara, Tashkent, Nukus, Bukhara, Tashkent print the total cost, calls, and delivery_cost.cache_info().
Solution
from functools import lru_cache

PRICES = {"Tashkent": 20000, "Bukhara": 35000, "Nukus": 50000}
calls = 0

@lru_cache(maxsize=None)
def delivery_cost(city):
    global calls
    calls += 1                  # the slow part runs only on a cache miss
    return PRICES[city]

orders = ["Tashkent", "Bukhara", "Tashkent", "Nukus", "Bukhara", "Tashkent"]
print(sum(delivery_cost(city) for city in orders))
print(calls)
print(delivery_cost.cache_info())180000
3
CacheInfo(hits=3, misses=3, maxsize=None, currsize=3)4. Pick the right structure
Write clean(message) that replaces the banned words spam, cheap, and gold (kept in a set) with ***. Clean and print "buy cheap gold now", "salom from Tashkent", and "cheap spam here".
Solution
banned = {"spam", "cheap", "gold"}

def clean(message):
    return " ".join("***" if word in banned else word for word in message.split())

for message in ["buy cheap gold now", "salom from Tashkent", "cheap spam here"]:
print(clean(message))buy *** *** now
salom from Tashkent
*** *** here5. Profile, fix, profile again
is_prime_slow(n) calls divides(d, n) for every d from 2 to n - 1. Write is_prime_fast(n) that stops once d * d > n. Profile counting primes from 2 to 2,999 with each, and print the function name, the count, and how often divides ran.
Solution
import cProfile
import pstats

def divides(d, n):
    return n % d == 0

def is_prime_slow(n):
    for d in range(2, n):
        if divides(d, n):
            return False
    return True

def is_prime_fast(n):
    d = 2
    while d * d <= n:
        if divides(d, n):
            return False
        d += 1
    return True

for is_prime in (is_prime_slow, is_prime_fast):
    with cProfile.Profile() as profiler:
        count = sum(1 for n in range(2, 3_000) if is_prime(n))
    calls = pstats.Stats(profiler).get_stats_profile().func_profiles["divides"].ncalls
print(is_prime.__name__, count, calls)is_prime_slow 430 601875
is_prime_fast 430 23091Call counts don't depend on your computer's speed.
Recap
- Measure first:
min(timeit.repeat(...))for snippets,time.perf_counter()in a@timerfor functions. sys.getsizeofis shallow;tracemallocshows which lines allocate the most.- Objects die when their reference count hits zero;
gccollects cycles;weakrefdoesn't keep objects alive. cProfilewithpstatssorted bycumulativeshows where time goes.- Sets,
join, built-ins,lru_cache, and__slots__fix most hot spots; leave run-once code alone.